


Next: Other basic examples
Up: Basic examples
Previous: Basic examples
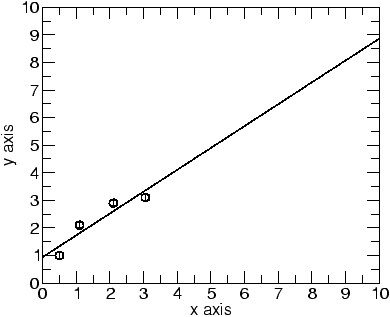
If you successfully compiled the function  that is set by default when you entered the Tutorial 1 area and you fit the default data you will get a plot like this
Figure 9:
Straight line curve fit
 |
Please check the various link available now after the fit was
made. Please check also the WebReport link.
Pedro Sebastião
2009-11-16